Click to set custom HTML
Every year I have my students complete an exit survey. I love getting to see what the students liked or felt was useful as well as what students did not enjoy or believed was not worthwhile. I typically plug in the numbers into excel, take a look, and make changes as needed. I share my findings with my co-teacher but never anyone else.
This year, I decided to improve my survey—more questions, more room for free responses, more critical thinking. I also decided to move away from paper forms which were tedious to tabulate and created a Google Form for students to fill out. This was a great success! The students seemed to be more thoughtful in their responses and truly enjoyed filling out the surveys on their electronic devices.
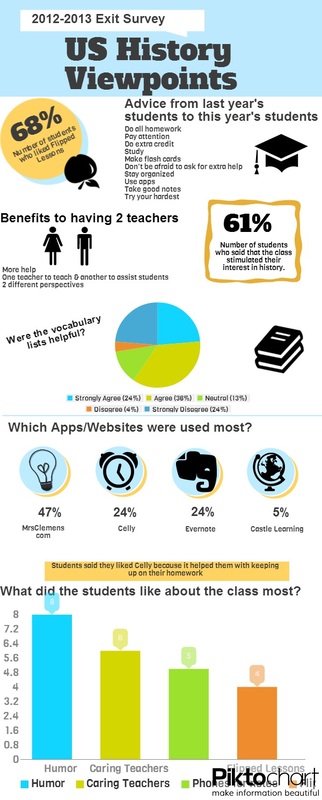
Additionally, I decided I really needed to share the results. Who better than my new students and their parents?!? So, I thought about the best way to present the findings. Some of the information I will hold back for closer to Regents time since it had to do with review methods. Some of the info is more for my co-teacher and me to improve the class. I choose information to present that will help to let students learn about the class and what makes it different from other US History classes in the building.
I used Piktochart to create an infographic. I’m not sure that it’s quite what I wanted it to look like but it gave me a good start at learning a new skill. I’m actually thinking about integrating a requirement for infographics in future student assignments. I’ll be sure to give an update as to the reactions of my students and their parents once the school year starts!
By the way, surveys such as this are great for Danielson 1b: Knoweldge of Students, 4a: Reflecting on Teaching, and 4c: Communicating with Families.
PS- I tried to embed the infographic here but for some reason I couldn't get it to work! I did get it to work here if you would like to view it more clearly.
This year, I decided to improve my survey—more questions, more room for free responses, more critical thinking. I also decided to move away from paper forms which were tedious to tabulate and created a Google Form for students to fill out. This was a great success! The students seemed to be more thoughtful in their responses and truly enjoyed filling out the surveys on their electronic devices.
Additionally, I decided I really needed to share the results. Who better than my new students and their parents?!? So, I thought about the best way to present the findings. Some of the information I will hold back for closer to Regents time since it had to do with review methods. Some of the info is more for my co-teacher and me to improve the class. I choose information to present that will help to let students learn about the class and what makes it different from other US History classes in the building.
I used Piktochart to create an infographic. I’m not sure that it’s quite what I wanted it to look like but it gave me a good start at learning a new skill. I’m actually thinking about integrating a requirement for infographics in future student assignments. I’ll be sure to give an update as to the reactions of my students and their parents once the school year starts!
By the way, surveys such as this are great for Danielson 1b: Knoweldge of Students, 4a: Reflecting on Teaching, and 4c: Communicating with Families.
PS- I tried to embed the infographic here but for some reason I couldn't get it to work! I did get it to work here if you would like to view it more clearly.
 RSS Feed